Help
Table of contents
RNAtango is a comprehensive platform for analyzing torsion and pseudotorsion angles in nucleic acid structures. The system calculates angular parameters from atomic coordinates, enabling detailed analysis, evaluation, and comparison in three usage scenarios. These scenarios cater to various analytical needs, ranging from studying a single model to comparing torsion angles across multiple models and assessing their similarities.
1. Homepage and input data
On the RNAtango main page, users can select from three usage scenarios, each offering an individual panel for data upload. Switching between scenarios is possible by clicking the respective buttons, with the first scenario, Single Model
displayed by default.
Initiating a new task involves loading a single data file containing the atomic coordinates of a nucleic acid molecule, setting input parameters (optional), and defining the necessary settings. The system accepts input files in PDB and mmCIF formats, which can be uploaded from a designated location (such as a local drive) or directly from the Protein Data Bank (Berman et al., 2000). In the latter case, it is only necessary to provide the PDB ID, and the system will automatically download the corresponding structure. New users of RNAtango can also utilize the available examples to become familiar with the system's functionality.
1.1. Single model
This scenario allows users to upload a single structure and analyse its angular parameters, computed for every residue in the structure (or in its fragment, if the user decides to limit the analysis to a selected region. Users receive visually friendly statistical summaries to enhance their understanding of the angular data (torsion and pseudotorsion angles).
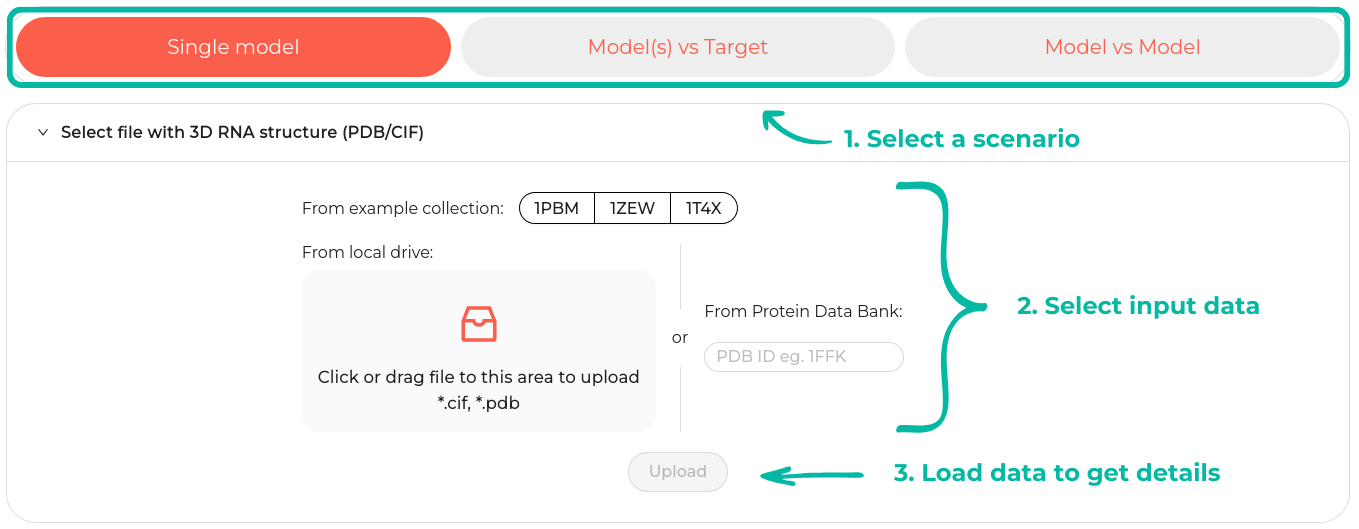
The available examples are sourced from the Protein Data Bank. By selecting one of these examples, the system automatically populates the PDB ID into the input field. Users also have the option to manually enter a PDB ID or upload a file from their local drive. Once the data has been successfully loaded, the Upload button is enabled.
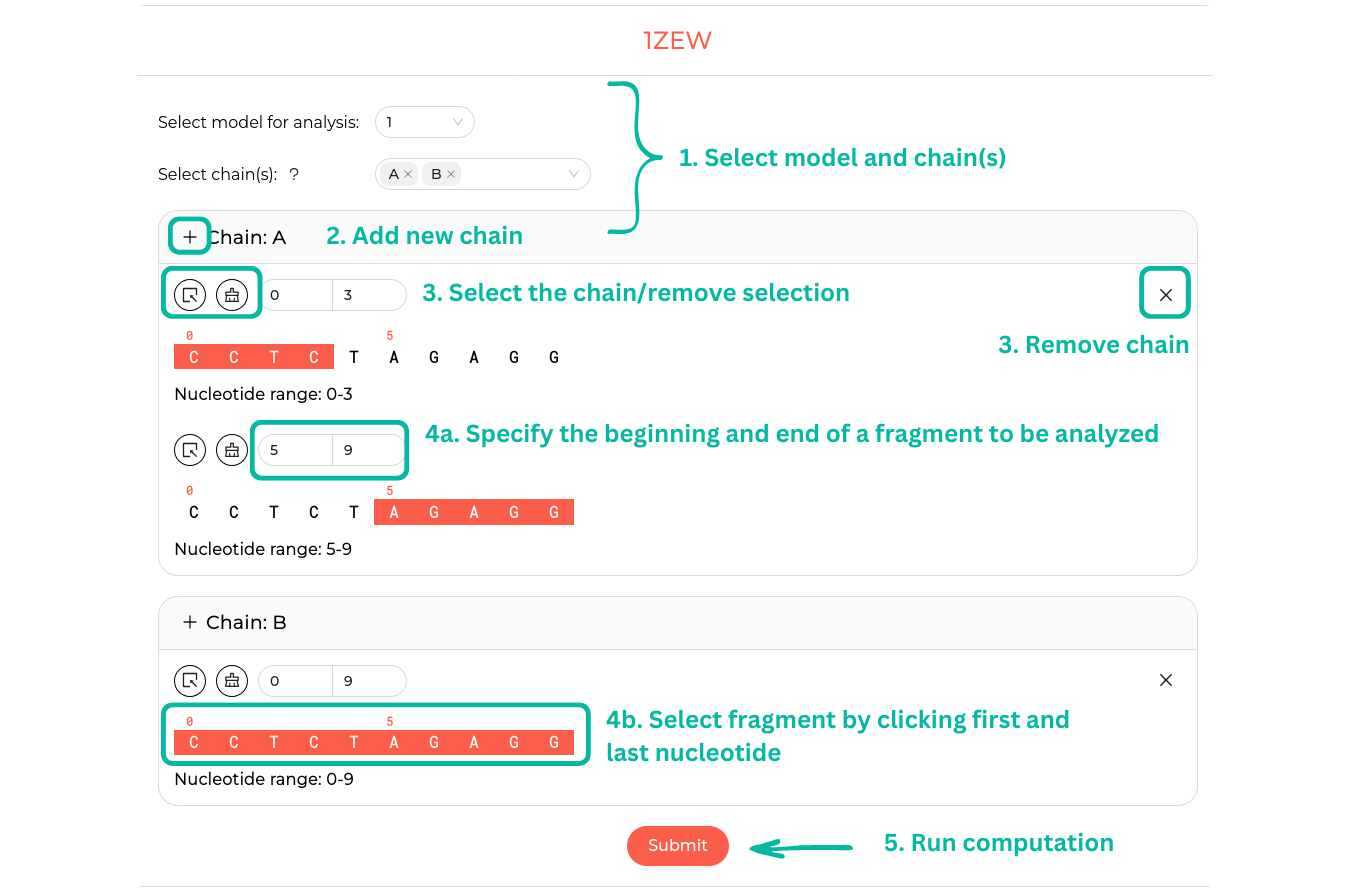
After successfully loading the data, users can select a model (with model 1 selected by default) and then choose one or more chains. For each chain, the entire range of nucleotides is displayed. Users can choose to analyze the full chain or a fragment of it (with the entire chain selected by default). The fragment can be selected in two ways: by entering the start and end numbers in the input fields, or by clicking on the start and end points of the chain. The panel includes buttons to select all chains, remove selections, or remove a chain. Users can add an additional instance of the same chain and select a different fragment of interest. Please note that if no chain is selected, results cannot be obtained. Upon clicking Submit, the user will be redirected to the result page.
1.2. Model(s) vs Target
This scenario enables analysis and comparison between the target and models. In the initial step, it is essential to define a target, which can be done similarly to the first scenario by either uploading a file or providing a PDB ID.
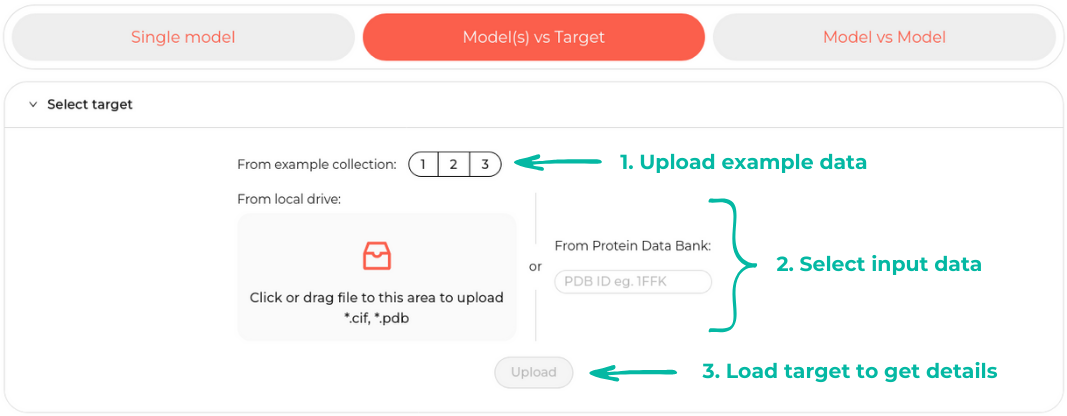
Examples in the second scenario include both the target and models, sourced from RNA-Puzzles.
| Example model name | Original name | Example model name | Original name |
| PZ18_model00 | 5TPY | PZ18_model04 | 18_Ding_1 |
| PZ18_model01 | 18_Szachniuk_1 | PZ18_model05 | 18_Chen_1 |
| PZ18_model02 | 18_Lee_1 | PZ18_model06 | 18_Das_1 |
| PZ18_model03 | 18_YagoubAli_1 | PZ18_model07 | 18_Dokholyan_1 |
Similar to the first scenario, after loading the target, users can choose to analyze either a fragment or the entire chain. However, in this scenario, only one chain can be selected, and the fragment must be continuous. If the fragment is discontinuous, a message will be dislayed indicating this issue.
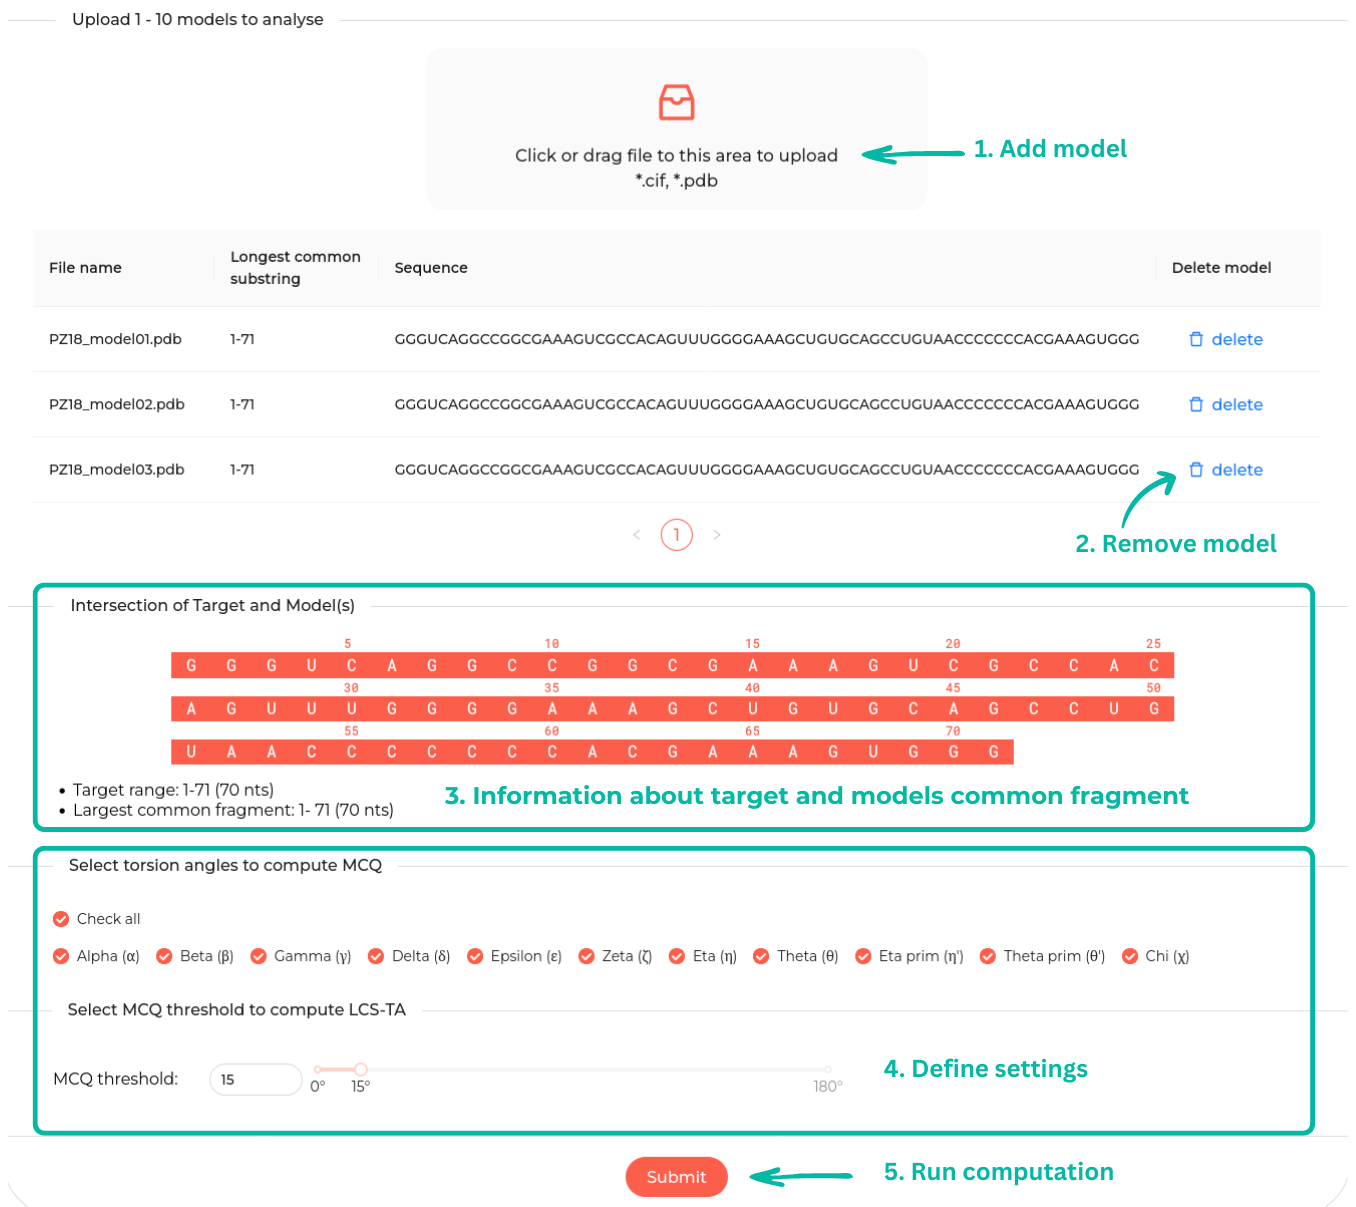
The table displays the uploaded models with options to add new models
or delete existing ones. If a new model does not share a common subsequence with the existing
ones, the upload process fails, and an error message is shown. By default, all torsion angles are selected
but this
selection can be adjusted; unselected angles will be excluded from
the MCQ computation.
Additionally, users can set the MCQ threshold between 0° and 180°.
The Submit button will become acive once at least one model
has been uploaded and at least one angle has been selected.
1.3. Model vs Model
This scenario is similar to the previous onebut extends the comparison to include evaluations between models; every model can serve as a target. The panel provides three examples. Selecting one of them uploads the respective set of models. Users can also upload their own models, though data upload from the Protein Data Bank is not supported in this scenario.
2. Angular measures in RNAtango
2.1. Torsion and pseudotorsion angles
RNA folds are characterized by several angular parameters. Six torsion angles, α, β, γ, δ, ε, and ζ, describe a nucleotide backbone; the angle χ determines the glycosidic bond; five torsion angles, v0, v1, v2, v3, v4, describe the ribose component. The following table presents torsion angles along with the atoms, which are used to compute them:
| Torsion Angle | Atoms involved | Torsion Angle | Atoms involved |
| α (Alpha) | O3'n-1-P-O5'-C5' | χ (Chi) | O4'-C1'-N1-C2 (pyrimidines) |
| β (Beta) | P-O5'-C5'-C4' | O4'-C1'-N9-C4 (purines) | |
| γ (Gamma) | O5'-C5'-C4'-C3' | v0 | C4'-O4'-C1'-C2' |
| δ (Delta) | C5'-C4'-C3'-O3' | v1 | O4'-C1'-C2'-C3' |
| ε (Epsilon) | C4'-C3'-O3'-O | v2 | C1'-C2'-C3'-C4' |
| ζ (Zeta) | C3'-O3'-P-O5'n+1 | v3 | C2'-C3'-C4'-O4' |
| v4 | C3'-C4'-O4'-C1' |
The ribose ring adopts two primary conformations: the envelope form, where four atoms are coplanar and one is out of a plane, or the twist form, featuring three coplanar atoms with two adjacent atoms displaced on opposite sides of the plane. These conformations can be distinguished based on a single angular parameter, the pseudorotation phase angle P, which elegantly substitutes for the five highly correlated angles v0 - v4. P , ranging from 0° to 360°, precisely represents the envelope or twist modes, offering a concise yet comprehensive description of the ribose geometry:

RNA structure analysis utilizes also pseudo-torsion angles, defined between non-bonded atoms. These angles, η, θ, η', and θ', are effectively used to describe RNA folding by providing a coarse-grained picture of RNA backbone shape.
| Pseudotorsion angle | Atoms involved |
| η (Eta) | C4'n-1-P-C4'-Pn+1 |
| θ (Theta) | P-C4'-Pn+1-C4'n+1 |
| η' (Eta prim) | C1'n-1-P-C1'-Pn+1 |
| θ' (Thete prim) | P-C1'-Pn+1-C1'n+1 |
2.2. MCQ
MCQ (Mean of Circular Quantites) has been proposed to compare RNA 3D structures given in trigonometric representation, which means that the comparison is based on angular parameters instead of atom coordinates (Zok et al., 2014). It is a distance measure, thus, the smaller its value, the more similar the compared structures are (the smaller the distance between them). Given two structures (ST and S'T) in trigonometric representation, one has to deal with circular quantities with the period of 2π. This implies a necessity to define the difference, diff(t, t'), between two circular quantities, t and t ', which can be either directed or undirected. In the first case, subtraction of values is not commutative, meaning one must differentiate between a minuend and a subtrahend value. Since we cannot determine this in the case of structure comparison, the undirected difference is used:

where

Based on these formulas, we define the distance, Δ(t,t'), between two angles, t and t':

The overall distance MCQ(ST, S'T) between structures ST and S'T given in the trigonometric representation, results from applying the following formula for the mean of structural quantities:

where r is the number of residues in S ∩ S' and T is a set of torsion
angles.
To compute MCQ, one can use the MCQ4Structures algorithm. The
algorithm is available as a Java application and can be downloaded from GitHub. It is also incorporated into the RNAtango computational engine.
2.3. LCS-TA
LCS-TA (Longest Continuous Segment in Torsion Angle space) has been designed as a similarity measure, thus, the larger its value, the more similar the compared structures are (Wiedemann et al., 2017). LCS-TA compares two RNA 3D structures, S and S', and identifies similar fragments within them. The similarity of fragments is defined as the MCQ value below a threshold defined by the user. LCS-TA operates in the space of torsion angles, so it is superposition-independent and does not involve finding the optimum alignment of structures. The method scans both structures stepwise along their backbones and uses a moving search window to select segments for comparison. In this routine, a divide and conquer formula is followed to determine the window size in each step. For a pair of window-highlighted segments, LCS-TA computes MCQ value over a set of torsion angles related to the segments. Next, it checks whether the MCQ value is below the threshold. At the output, LCS-TA provides the length of the longest continuous segment satisfying similarity condition (i.e., fitting below the threshold) and segment location (its first and last residue numbers). The resulting segment's length (referred to as LCS) is the measure of local similarity. The LCS-TA algorithm is available as a Java application and can be downloaded from GitHub. It is also incorporated into the RNAtango computational engine.
3. Results of data processing
Once a task is initiated, the system directs users to a result page that displays the task status (Task uploaded, Queueing, Processing, Task completed). Each result page is assigned a unique URL, with the suffix being the task identifier, which is also displayed in the header of the result page. Upon completion, the page will either indicate a failure to complete the task or, if successful, present the data hierarchically from top to bottom. Each scenario provides a task ID along with the results. Results are stored in the database for one week before being deleted, during which time users can revisit the result page.

3.1. Single Model
On the result page, users are presented with tables where each table represents a continuous fragment of a chain. These tables can be expanded or collapsed to view the data. The columns correspond to the torsion angles for each residue. Users can to select or deselect individual rows or columns. When downloading a CSV file, only the data from the selected rows and columns will be saved. For each torsion angle, a histogram is generated to show the distribution within specific ranges (each range spanning 15°). This histogram can be downloaded in SVG format. At the bottom of the result page, a bar plot displays statistics for the Chi and P angles.
3.2. Model(s) vs Target
Upon successful completion of the computation, users will receive the analysis and can choose which model to display using a selection field. The result page presents a comparison of MCQ values between models in both the table and a heatmap formats. Users can access detailed information for each model, including angular parameters. Secondary structures are color-coded according to MCQ values, and a 3D visualization is available through Mol*.
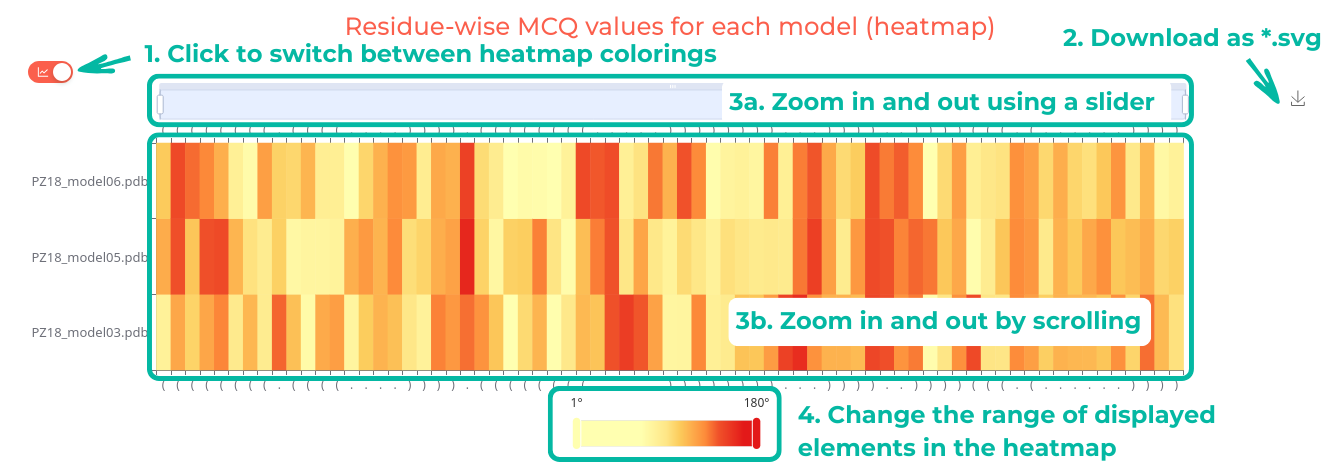
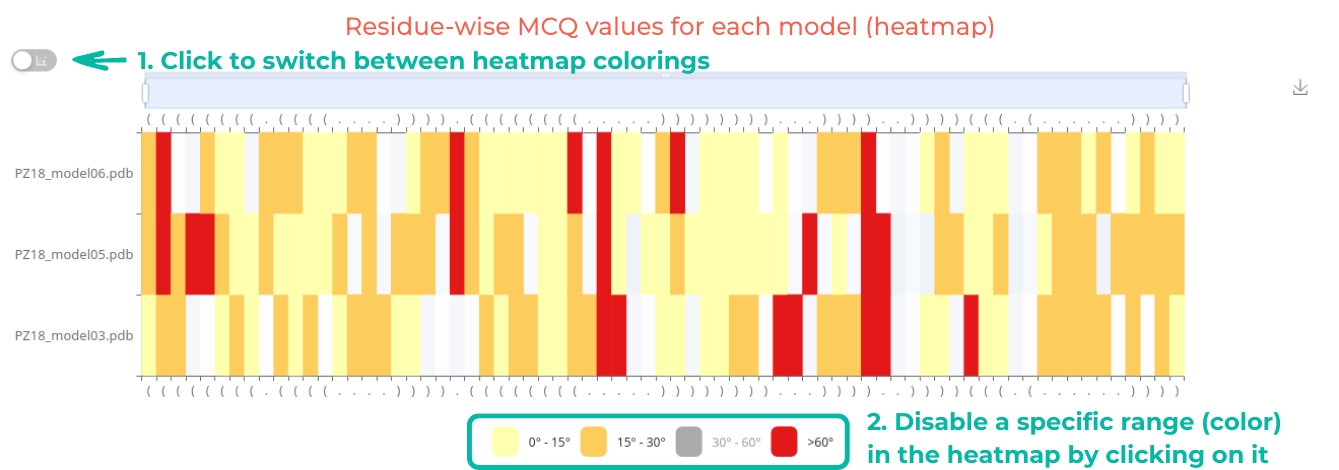
Users can interact with the heatmap by clicking to switch between a continuous range from 0° to 180° (Figure 6. top) and discrete ranges of 0°-15°, 15°-30°, 30°-60°, and >60° (Figure 6. bottom). The heatmap can be zoomed in or out using a slider or by scrolling. Additionally, users can adjust the range of displayed elements and download the heatmap as an SVG file.
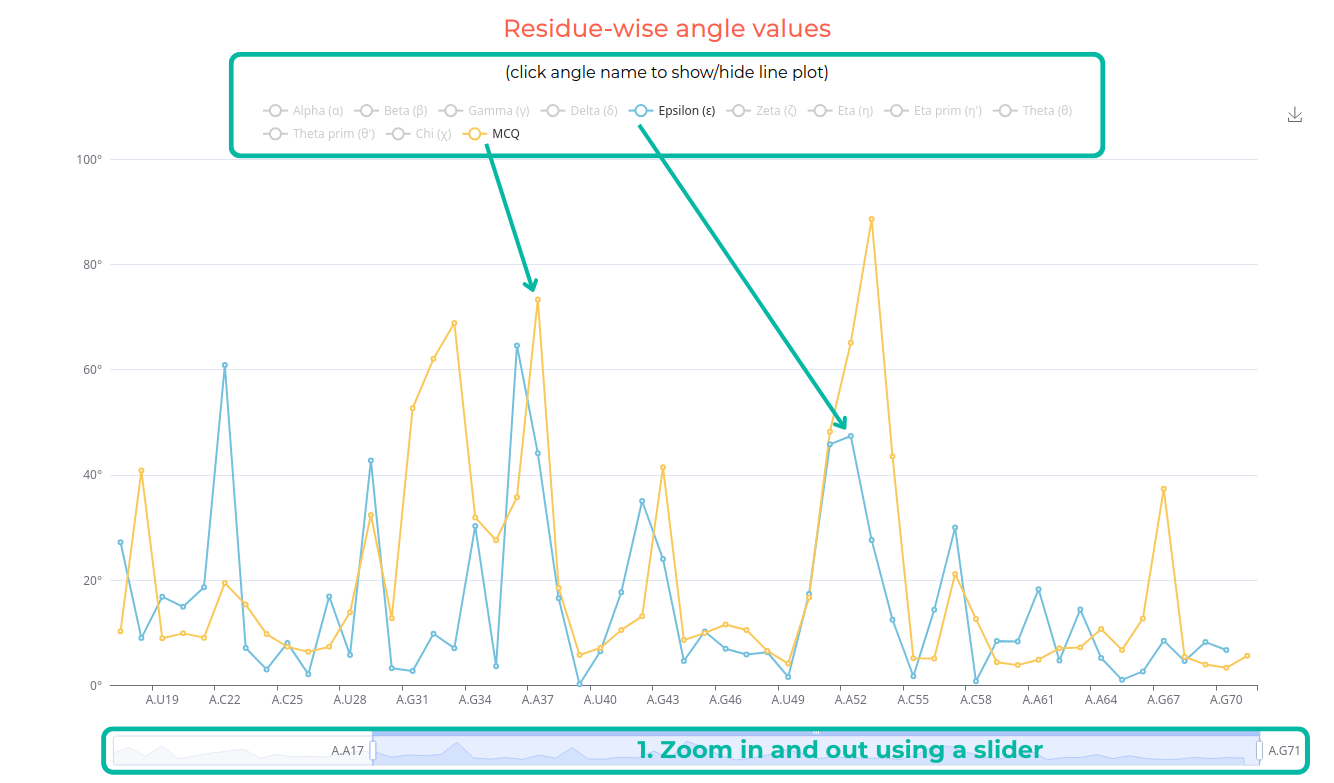
Specific line plots can be enabled by clicking the button corresponding to the angle name. Additionally, users can zoom in on a specific fragment using the slider at the bottom.
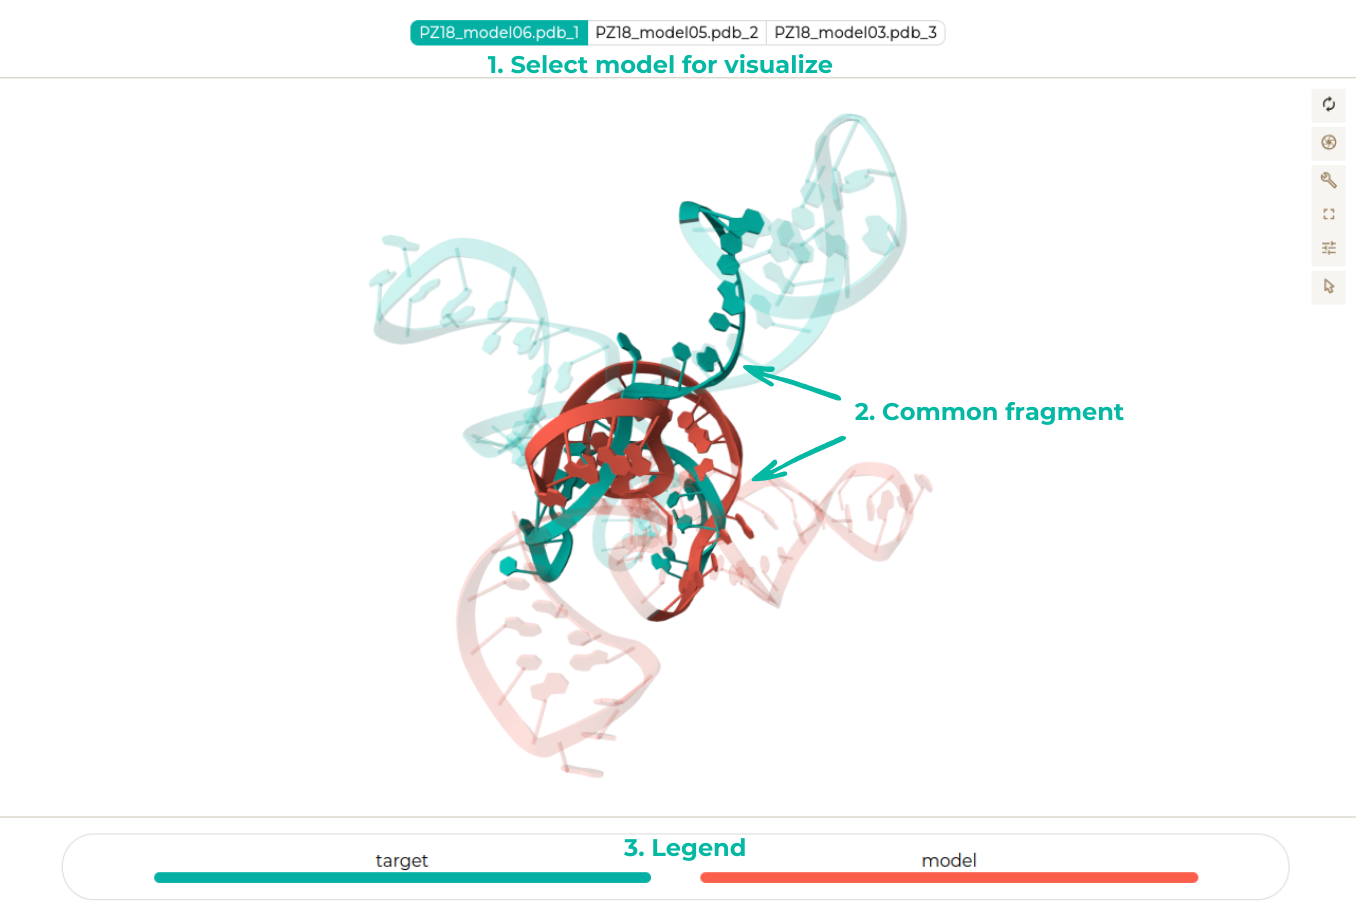
This option allows users to focus on a specific model for detailed analysis. The visualization highlights the common fragments among selected models, emphasizing key regions of interest. This feature aids in understanding shared structural elements and their significance.
3.3. Model vs Model
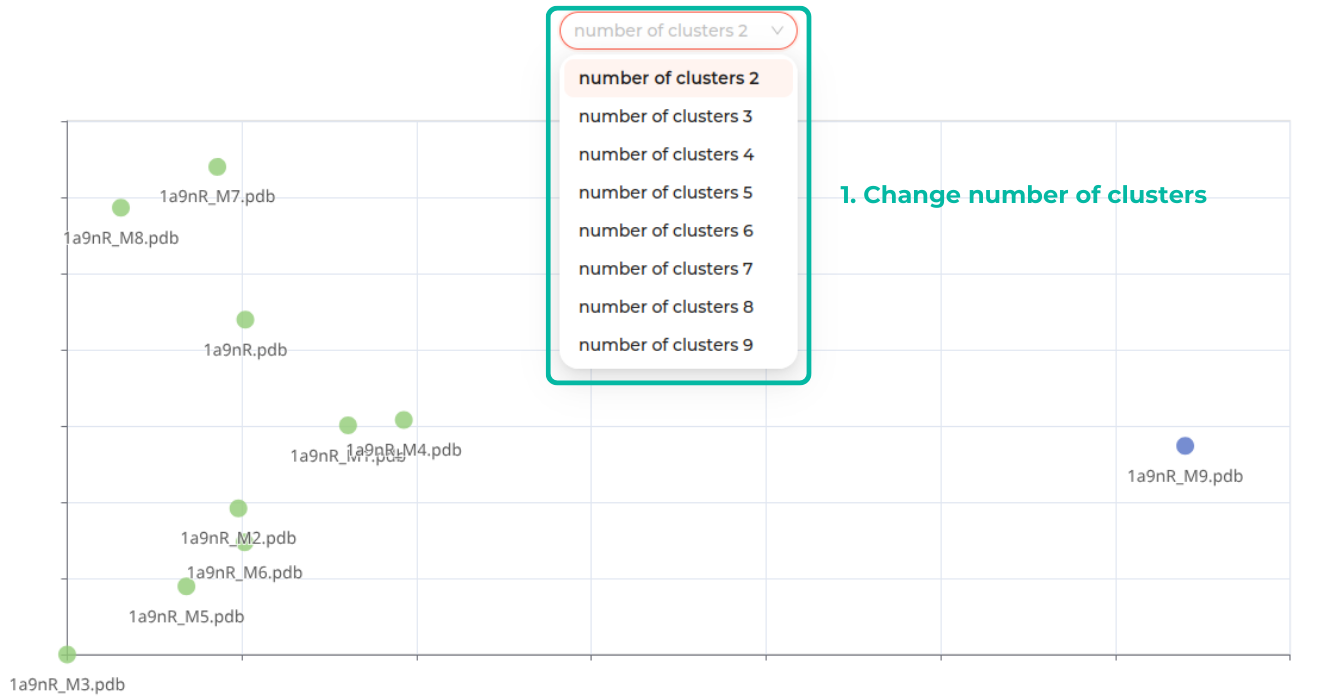
On the result page, a table compares each model with others using two metrics: LCS-TA (Longest Continuous Segment in Torsion Angle space) and MCQ (Mean of Circular Quantities). Additionally, the models are visualized in a dendrogram and a scatter plot. Users can also adjust the number of clusters.

This scenario allows users to select a single structure as the target. The results are then displayed similarly to those in the Model(s) vs Target scenario for the chosen target.
4. System requirements
RNAtango is designed for desktop devices and is compatible with most common web browsers. For optimal performance, using the latest versions of these browsers is recommended.
 |  | |
| Chrome 126 | Firefox 128 | Safari 17.5 |